AI for data Visualizing : what is it?
For a long time, interactive raw data Visualizing have been available with the goal of gaining useful insights. To highlight dependencies and relationships between data points, spot patterns, and promote data-driven decision-making, business users heavily rely on line charts, column graphs, scatter plots, network graphs, heat maps, pie diagrams, funnel charts, and other visual representation techniques.
However, typical data visualization software based on statistical models is now insufficient to handle the problems presented by Big Data due to the exponential development of the number of data. More potent techniques are required for the analysis and representation of the enormous datasets that organizations use. Artificial intelligence (AI) systems powered by neural networks and huge language models can swiftly sort through enormous datasets, spot trends with the blink of an eye, and present the findings in an understandable visual format on interactive dashboards.
Showcasing the benefits of AI-driven data visualization

- minimal learning curve. Even non-technical individuals may use most AI visualization tools with ease thanks to their intuitive UI and simple navigation. Because they typically rely on drag-and-drop features for adding data, offer customization charts, and provide straightforward data management and arrangement operations, they don’t require sophisticated technical expertise to handle.
- seamless integration of data sources. In order to improve data processing workflows and expedite data collecting, sophisticated AI techniques facilitate the smooth integration of various data sources.
- robust security. The highest level of security for data AI algorithms used for training and analysis is of particular concern to software developers. The best security measures used in such systems include data encryption, both in transit and at rest, tokenization, loss prevention, optimization, and access control.
- choices for automated data processing. To enhance visualization results, AI automates a number of per-processing tasks, such as data engineering, cleaning, augmentation, correction, and the like. Additionally, by summarizing various datasets that include textual, audio, video, and image data, artificial intelligence can uncover insights.
- improved analysis of data. Data analytics efforts are elevated to a new level by reports produced by AI solutions, which offer conclusions pertaining to each data story.
- better judgment. Compared to texts or numbers, AI visualization technologies swiftly transform complex data into meaningful insights that are simpler for the human brain to understand. As a result, analysts make quick and precise data-driven decisions that are crucial for advancing business.
Use cases of AI for data visualization
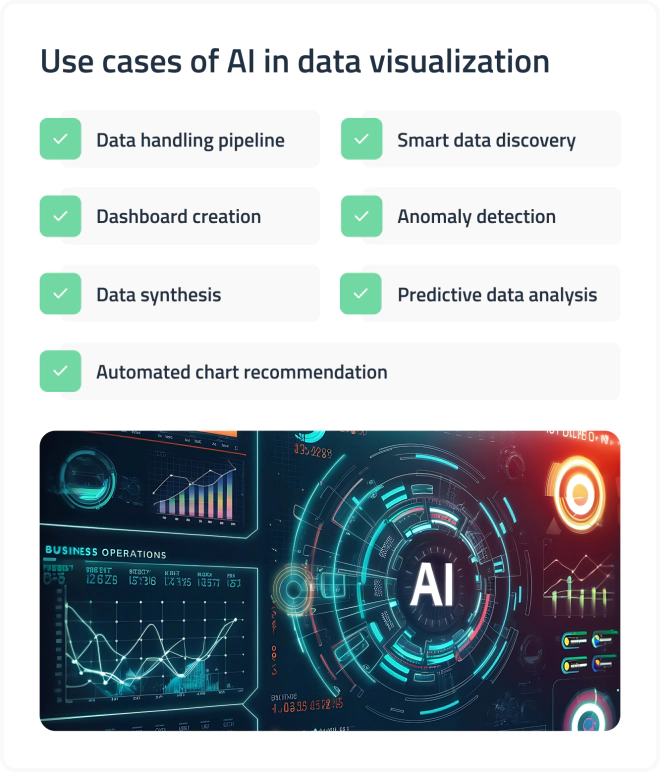
pipeline for handling data
Datasets must go through a series of per-processing steps before they can be seen. Data mining (finding information based on particular criteria), transformation (converting data from one format to another), assessment (measuring the quality of datasets), comparison (identifying similarities and differences in data), and more are all made easier and more efficient by AI mechanisms.
Intelligent data discovery
AI is adept at uncovering hidden connections and patterns in examined datasets, suggesting avenues for additional research and information visualization. Furthermore, trends and changes can be predicted and modeled as plausible hypotheses thanks to the sophisticated reasoning capabilities offered by AI and ML tools.
Automated chart suggestion
The most illuminating chart kind for analysis result depiction that can successfully express the story behind it and transform the data in them into actionable insights can be recommended by high-end AI solutions with embedded analytics and business intelligence capabilities.
development of a dashboard
Although AI significantly changes the process, traditional visualization tools can also accomplish it. When users ask questions like “show the dynamics of conversion rate within the previous six months” or “compare personnel productivity across departments,” they will immediately receive a visual graph or even a full dashboard that displays the answer.
Identification of anomalies
AI systems are taught to identify typical trends and identify abnormalities. Equipped with these features, AI technologies present data in a way that makes it simple to identify anomalies and outliers in data patterns.
Synthesis of data
By investigating possible scenarios or performing what-if research, analysts can more effectively analyze trends and patterns in graphical data. Specialized data is needed for these processes, and AI algorithms are capable of producing it in large quantities.
Analyzing predictive data
The ability of key decision-makers to predict developments in the niche is critical to an organization’s business success. These estimates are visualized by AI-powered predictive analytics tools, which enable analysts to predict revenue influxes, anticipate customer behavior, enhance risk assessment, and more. You should be aware of the kinds of artificial intelligence that can be used for data visualization in order to optimize these advantages.